Table of contents
“Measure your results” is the common wisdom in the online sales world. How can you improve on something you can’t measure, right? Fortunately, the most common, free, and robust tool for measuring your store’s online performance is Google Analytics. Though an extremely useful tool, it’s also not the most intuitive platform to use. To help you get over the learning curve, we’ve written up this beginner’s guide to Google Analytics to evaluate your online store’s performance.
Though the internet is filled with Google Analytics materials, this post aims to bring clarity and let you, as an online store owner, know exactly what you need to set up, which stats to pay attention to, and how to act on them.
Google Analytics for beginners: setting up your account and ecommerce tracking
First, you’ll have to create a Google account. The good news – if you have a Gmail account, then you’ve got a Google account. Go to Google Analytics and sign in.
The next step is to connect your online store to Google Analytics. For each platform, this happens slightly differently. Go to your platform’s FAQ and look up how to connect with Google Analytics. Platforms like Shopify, Gumroad, Storenvy, BigCommerce, Squarespace, Weebly, and Ecwid offer a built-in solution that just requires you to copy and paste your Google tracking code into a field in your store’s settings. Platforms like WooCommerce and Big Cartel require an additional plugin/app.
When that’s done, you’ll see an empty overview of your store in your Google Analytics account. Google Analytics can only begin to collect data once it’s been set up, meaning that it will take some time for data to populate your Google Analytics account as the data is collected over time.


Set up Google Analytics ecommerce tracking
After setting up Google Analytics for your store, there are a few more tweaks you have to complete to access data that specifically tracks information relevant to ecommerce, like how much has been purchased, most popular products, and more.

To enable ecommerce tracking, go to your account settings. You can find that by clicking “Admin” next to the cog icon at the bottom of the left-hand menu, then clicking on “View Settings.”
Choose the “Ecommerce Settings” option on the left. You’ll see this page:

Then toggle the “Enable Ecommerce” button to “On,” then choose “Next Step,” then “Submit.” Your Google Account will now begin tracking your store’s ecommerce data.
You’ll see that there is also an option to turn on Enhanced Ecommerce, which lets you define a checkout funnel and provides additional reports in the Ecommerce section. But seeing as this is a beginner’s guide and Enhanced Ecommerce is not necessarily for everyone, we won’t go into more detail about it.
To find an overview of your ecommerce data, go to Conversions->Ecommerce->Overview

This page will offer you in-depth data of the behavior of your visitors, as well as your store’s general performance.
Google Analytics statistics you should pay attention to
When you enter your Google Analytics account, you’ll be shown your site’s basic Audience Overview. It will look something like this:

What you’re seeing is an overview of visits to your site.
-
- The large blue graph in the middle shows you how many visitors you’ve had to your site during the defined date range.
Note: a session is counted as each time a visitor browses through your website. - Shows you the selected date range – you can click on it to change the date range you want to see – by changing this, this new range will also be reflected in any other pages.
Note: you can also use the “compare to” option when setting the date range to compare your performance with another moment in time. - Information on your visitors’ behavior on your site, including:
– how many unique visitors arrived (users)
– how many pages they get to/have been interested enough to click on (pages/sessions)
– how long they spend on your site on average (avg. session duration)
– how quickly they leave your site (bounce rate). - Information on who your visitor is – how many users are visiting for the first time (new visitor) and how many have returned (returning visitor).
- The large blue graph in the middle shows you how many visitors you’ve had to your site during the defined date range.
This information provides a general overview (as the page name states), but all of these statistics can be considered in a deeper context that can provide you, the store owner, with more valuable and actionable insight.
Acquisition: know what brings in the visitors
Visitor acquisition is an important statistic for anyone selling online. Without visitors, you can’t have any purchases. Visitors and purchases often (though not always) go hand in hand. The first step for any ecommerce entrepreneur would be to try to get visitors to their page, and only then can they try to convert them into paying customers.
To see your visitor acquisition statistics, go to Acquisition->All traffic->Source/Medium.

You’ll see a detailed overview of each channel’s performance.
What do the different channels mean?
(Direct) / (none) – this is when Google Analytics is not able to define where the visitor came from. Either they typed your store’s URL directly into their browser, or they accessed your store from a source that Google Analytics can’t track. Some known sources are: a link in Skype, clicks on a bookmark, a link in a PDF document, a link in desktop software, and more.
Google / organic – these are visitors who have accessed your site through either Google or any other search engine.
Anything ending in / referral – visitors who have accessed your site through a referring channel that isn’t from a search engine.
What your channel information tells you
This shows you what channels are working well to bring in visitors. You can either choose to pay more attention to them to boost their performance, or if you see underperforming platforms, you’ll know that you have to take a critical look at why they’re underperforming, and what you can change to help them perform better.
This might also reveal unexpected traffic sources, such as a blog that unbeknownst to you published a link to your store.
Bounce rate: see if people want to stay on your store, or uncover major website flaws
Getting visitors is just the first step. You also want to be able to hold their attention. Bounce rate shows you how quickly your visitors leave your site. The lower the bounce rate, the better.
Bounce rate is the percentage of visitors that leave your site after only viewing one page.
If your bounce rate is high, then you’ve got a problem with your site. It could be a plethora of things. The first to consider is site speed. 40% of online visitors are likely to leave a page if it takes over 3 seconds to load.
Check your site speed using this Pingdom tool, or use the Google Analytics tool by going to Behavior->Site Speed->Overview. You’ll not only see average load times, but also specific product pages, to be able to pinpoint problems.
If your site speed is over 3 seconds, check your image size, they might be too big to load quickly. Send your images through TinyPng to compress size without compromising quality, then upload to your store again.
Another factor could be that your visitor acquisition tactics aren’t on point – your visitors might be expecting something else. Make sure that you set expectations when bringing in visitors.
Location: who you should be catering to

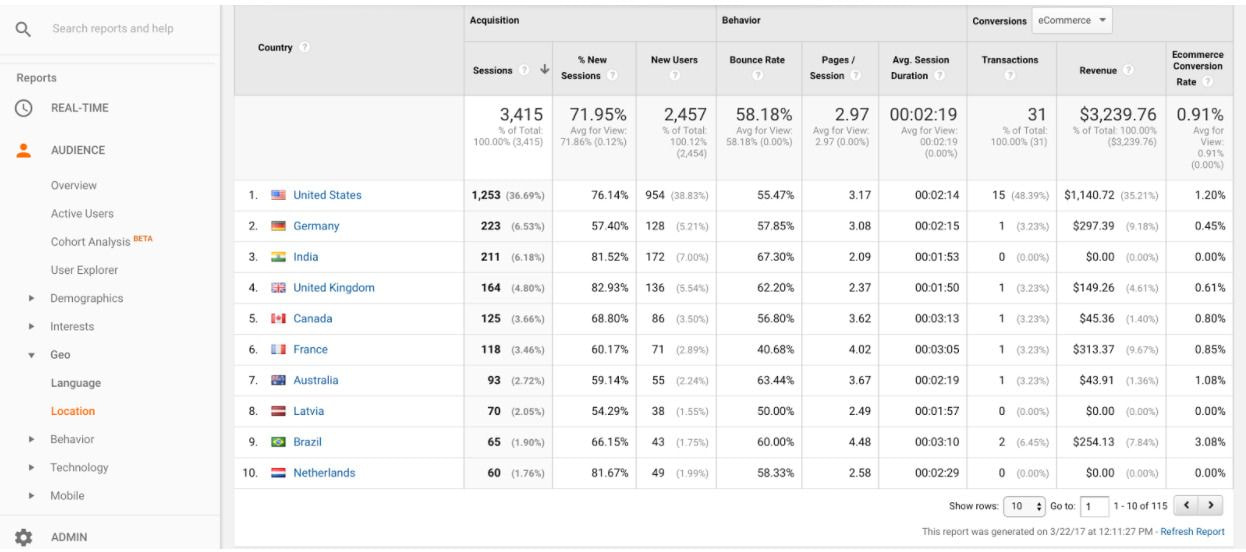
Go to Audience->Geo->Location to get an overview of who’s accessing your site. As an ecommerce store owner and seller of physical products, it’s important to know who’s visiting and where you’ll be selling to.
If you see that you have a high visitor rate from a certain country, you can use that information to cater to them specifically. Whether that means offering targeted Facebook ads, or adding a “We ship to Germany!” bar at the top, or even offer a country-specific design, this can influence your decision making. You can also choose to create specific shipping rates to that country, or at least address international shipping on your product page.
Ecommerce overview: see how your sales are going
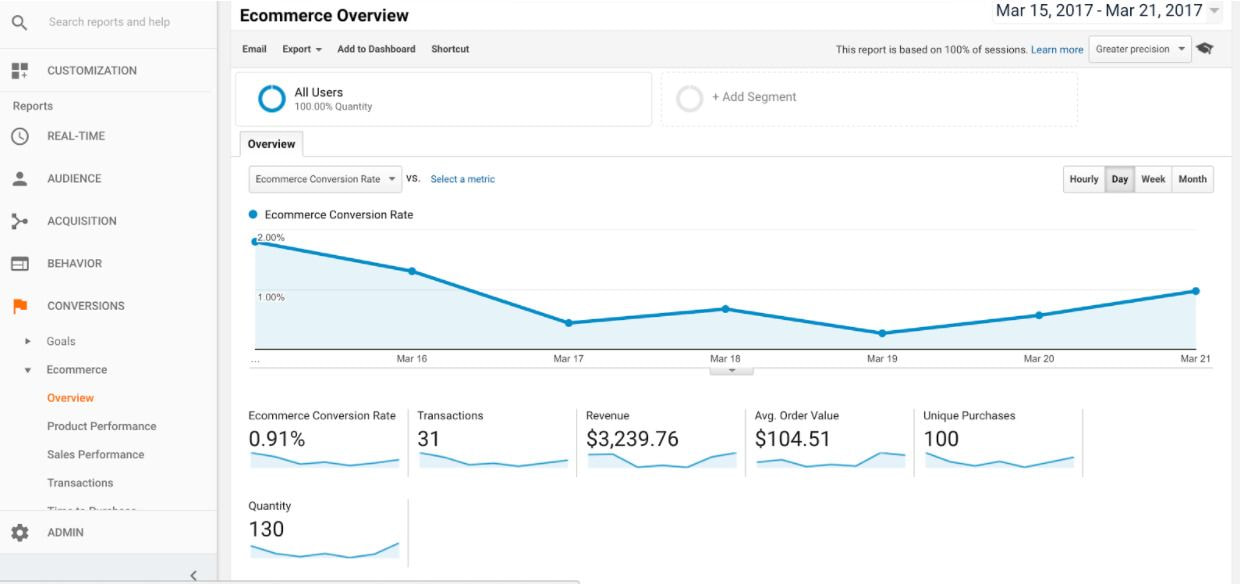
With an activated “Ecommerce” section in Google Analytics, you’ll have a great overview of your store’s monetary performance. Go to Conversions->Ecommerce->Overview for this view:

On this graph, the most interesting statistic at a glance is the “revenue” field. This gives you an idea of how much you’ve brought in over the defined time period.
Product performance: use data to drive your marketing activities
For more in-depth data on your store’s performance, go to the “product performance” tab. There you’ll see your most purchased items.

When you know your most popular items, you can start to think about how to increase sales even more. For example, if you see that mugs are your most popular item, you could:
- Add more mug designs
- Start a mug sale
- Use mugs as your product image in any sales/advertising campaigns
Take the guesswork out of your store’s development
What we see with these statistics is information that can inform future decisions related to your store – whether it’s choosing which product image to place on your ad, or which social media platform to focus your energy on. With the “Ecommerce” feature activated on Google Analytics, you can see the monetary return of any of these positions and use your product sales as a foundation for decision making.
Has this piqued your interest in opening your own online store? Download our free ebook below with a step-by-step guide to getting started!


